I came across the library {hexSticker} while trying to come up with an image to use for a post about creating Excel workbooks in R.
Since {openxlsx} does not have a logo, I thought I would make one myself.
Shixiang Wang’s post about using hexSticker was a really helpful resource for learning about this package.
One thing I was curious about was whether you could use {gt} in the sticker itself.
Here we make a simple table with some data in it using the mtcars dataset.
# Make a simple gt object
as_tibble(mtcars, rownames = "car") %>%
# Take top 5 cars by Horsepower
slice_max(n = 5, order_by = hp) %>%
# Select a few columns
select(car, mpg, cyl, hp) %>%
gt() -> simple_gt
# Print the gt object
simple_gt
car
mpg
cyl
hp
Maserati Bora
15.0
8
335
Ford Pantera L
15.8
8
264
Duster 360
14.3
8
245
Camaro Z28
13.3
8
245
Chrysler Imperial
14.7
8
230
# Try using sticker() with a gt object
sticker(simple_gt,
package="openxlsx", p_size=20, s_x=1, s_y=.8, s_width=1.25, s_height=.9,
h_fill="#33c481", h_color="#1D6F42", filename="/blog/create-excel-workbooks-in-r/openxlsx-logo.png")
## Error: Assigned data `subview` must be compatible with existing data.
## x Existing data has 1 row.
## x Assigned data has 16 rows.
## i Row updates require a list value. Do you need `list()` or `as.list()`?
So it looks like we can’t easily use a {gt} table with hexSticker().
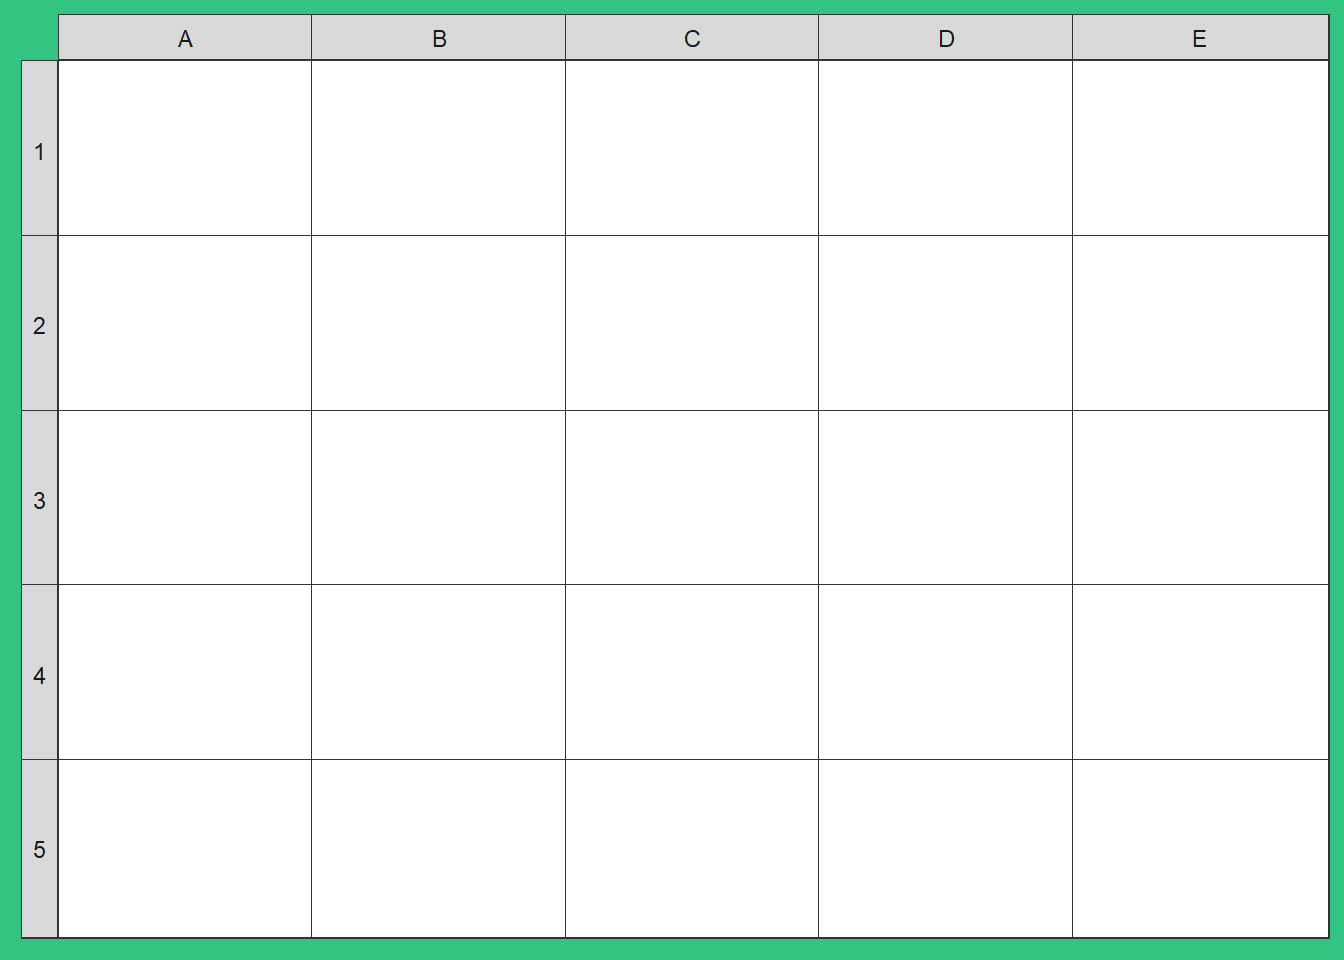
Then we’ll use {ggplot2} to make a plot that mimics a spreadsheet.
# Make a tibble that will have rows and columns similar to Excel
spreadsheet = tibble(
col_labs = LETTERS[1:5],
row_labs = 1:5,
x_data = runif(n = 5),
y_data = runif(n = 5)
)
Here’s what that looks like:
The values in x_data and y_data aren’t too important because we’ll not be using any geoms, so any old continuous variables will do the job.
# Plot this tibble without geoms
spreadsheet %>%
ggplot(., aes(x = x_data, y = y_data))+
# Use facets as the row and column labels
facet_grid(row_labs~col_labs, switch = "y")+
theme_bw()+
# Remove some text, reduce panel spacing and gridlines
theme(axis.text = element_blank(),
axis.title = element_blank(),
axis.ticks = element_blank(),
panel.spacing = unit(-.1, "lines"),
panel.grid = element_blank(),
strip.text.y.left = element_text(angle = 0),
strip.text.x = element_text(lineheight = unit(-1, "lines")),
strip.switch.pad.grid = unit(0, "lines"),
plot.background = element_rect(fill = "#33c481", colour = "#33c481")) -> excel_table
Here’s what the plot looks like:
excel_table
The sticker() function is fairly straightforward. It takes the plot object as the first argument (known as the subplot) while the name of the package is the package argument.
Various arguments are available for the position, size, colour, angle, etc. of the subplot (e.g. s_width), the package name (e.g. p_fontface), or the hexagon itself (e.g. h_fill).
The hex I am making is pretty simple so I didn’t dive much deeper than these settings, but there are lots more in the help files that will help you to customize your hex sticker exactly as you want it.
# Make the sticker
sticker(excel_table,
package="openxlsx", p_size=20, s_x=1, s_y=.8, s_width=1.25, s_height=.9,
h_fill="#33c481", h_color="#1D6F42",
filename="/blog/make-package-stickers-with-hexsticker/openxlsx-logo.png")
Simple, but effective!
Just the code
knitr::opts_chunk$set(error = F, warning=F, message = F)
# Set options
options(knitr.graphics.error = FALSE,
fig.retina=2
)
library(tidyverse)
library(hexSticker)
library(here)
library(gt)
library(reactable)
library(htmltools)
# Source R Scripts
list.files(here("static", "R"), full.names = T, pattern = "theme") %>%
walk(source)
.spreadsheet-div {
text-align: center;
margin: 2vw;
}
.gt_table {
margin-bottom: 20px
}
library(tidyverse)
library(hexSticker)
library(gt)
# Make a simple gt object
as_tibble(mtcars, rownames = "car") %>%
  # Take top 5 cars by Horsepower
  slice_max(n = 5, order_by = hp) %>%
  # Select a few columns
  select(car, mpg, cyl, hp) %>%
  gt() -> simple_gt

# Print the gt object
simple_gt
# Try using sticker() with a gt object
sticker(simple_gt,
        package="openxlsx", p_size=20, s_x=1, s_y=.8, s_width=1.25, s_height=.9,
        h_fill="#33c481", h_color="#1D6F42", filename="/blog/create-excel-workbooks-in-r/openxlsx-logo.png")
# Make a tibble that will have rows and columns similar to Excel
spreadsheet = tibble(
  col_labs = LETTERS[1:5],
  row_labs = 1:5,
  x_data = runif(n = 5),
  y_data = runif(n = 5)
)
spreadsheet_tbl = spreadsheet %>%
reactable(
sortable=F,
showSortIcon=F,
bordered = T,
compact = T,
fullWidth = F,
defaultColDef = colDef(
headerStyle = list(background = my_col_pal[5],
color = my_col_pal[1])
),
columns = list(
x_data = colDef(
format = colFormat(digits = 3)
),
y_data = colDef(
format = colFormat(digits = 3)
)
),
class = "spreadsheet-tbl",
style = list(
textAlign = "center"
)
)
div(class="spreadsheet-div",
spreadsheet_tbl)
# Plot this tibble without geoms
spreadsheet %>%
  ggplot(., aes(x = x_data, y = y_data))+
  # Use facets as the row and column labels
  facet_grid(row_labs~col_labs, switch = "y")+
  theme_bw()+
  # Remove some text, reduce panel spacing and gridlines
  theme(axis.text = element_blank(),
        axis.title = element_blank(),
        axis.ticks = element_blank(),
        panel.spacing = unit(-.1, "lines"),
        panel.grid = element_blank(),
        strip.text.y.left = element_text(angle = 0),
        strip.text.x = element_text(lineheight = unit(-1, "lines")),
        strip.switch.pad.grid = unit(0, "lines"),
        plot.background = element_rect(fill = "#33c481", colour = "#33c481")) -> excel_table
excel_table
# Make the sticker
sticker(excel_table,
        package="openxlsx", p_size=20, s_x=1, s_y=.8, s_width=1.25, s_height=.9,
        h_fill="#33c481", h_color="#1D6F42",
        filename="/blog/make-package-stickers-with-hexsticker/openxlsx-logo.png")
knitr::include_graphics("/blog/make-package-stickers-with-hexsticker/openxlsx-logo.png")